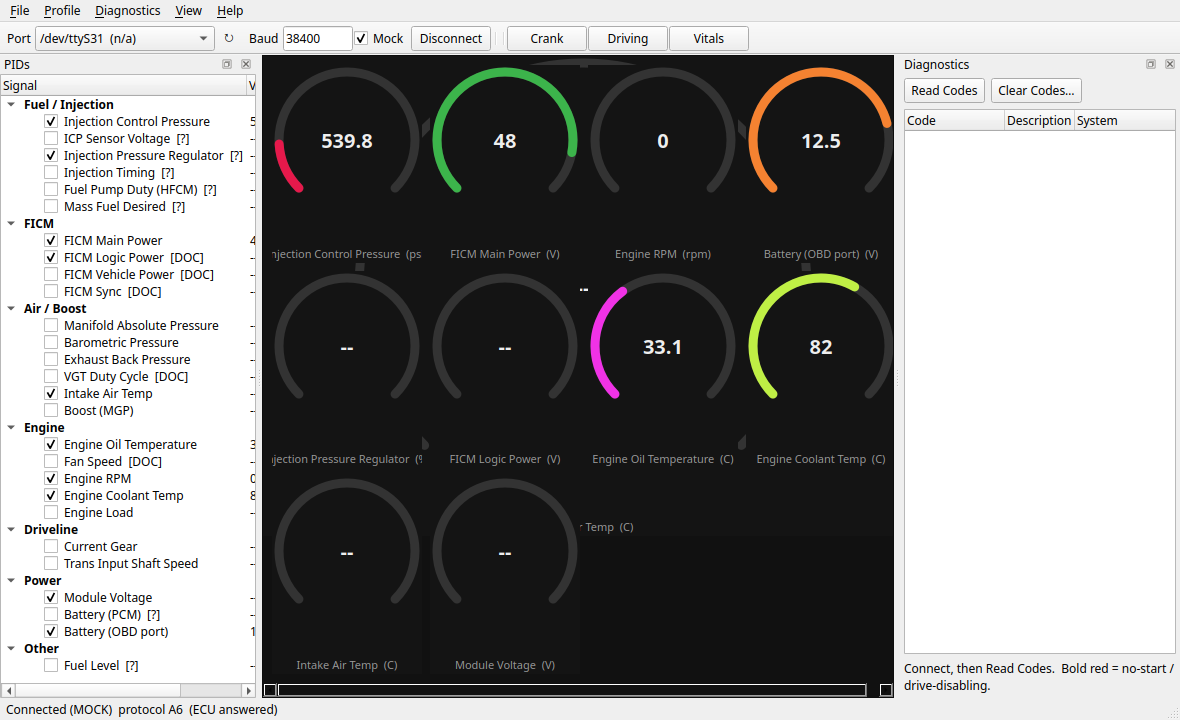
gui/widgets.py:
- MultiAxisPlot -- overlay with one Y axis PER UNIT (psi/V/rpm/C/%), linked
  ViewBoxes on X, so mixed-scale signals are readable at true values
  (base left axis + up to 4 right axes).
- SinglePlot -- one shared axis for the Normalize (% of range) mode.
- ArcGauge -- 270deg arc gauge with peak tick + numeric readout, own dark bg.
- GaugeGrid -- scrollable grid of gauges.

gui/main.py:
- Graph page is now a multi-axis/single-axis sub-stack; Normalize toggles
  between true multi-axis (raw) and single-axis (%). curves map key->color;
  plot ops route to the active graph widget.
- Gauge View menu enabled (3rd center page); gauges update on tick with peak.
- Theme applies to both plot widgets; profile switch clears graphs/gauges.

Fix: ArcGauge QPen built via setCapStyle (the QPen(...cap=...) kwarg segfaults
PySide6). Validated headless: driving preset -> 6 unit groups across 5 axes,
gauge view renders, normalize round-trips, profile-switch clears cleanly.
obdcore + diagnostics tests still pass.

Co-Authored-By: Claude Opus 4.8 (1M context) <noreply@anthropic.com>
Claude-Session: https://claude.ai/code/session_016yT89n4zR4qbrySoSiEyZs
146 KiB
1180x720px
146 KiB
1180x720px